
Free edition
Use WBS and Gantt charts without a time limit.
- Create and edit Gantt charts
- Import and export Excel files
- Save .ploto files on your PC
An Excel schedule breaks a little more with every row you insert. Ploto imports it as-is and turns it into a Gantt chart — free to build, edit, and export back to Excel. Add Kanban and other views with a one-time Pro purchase. AI Terminal lets your own AI work with the schedule and is available separately with 60 free operations.
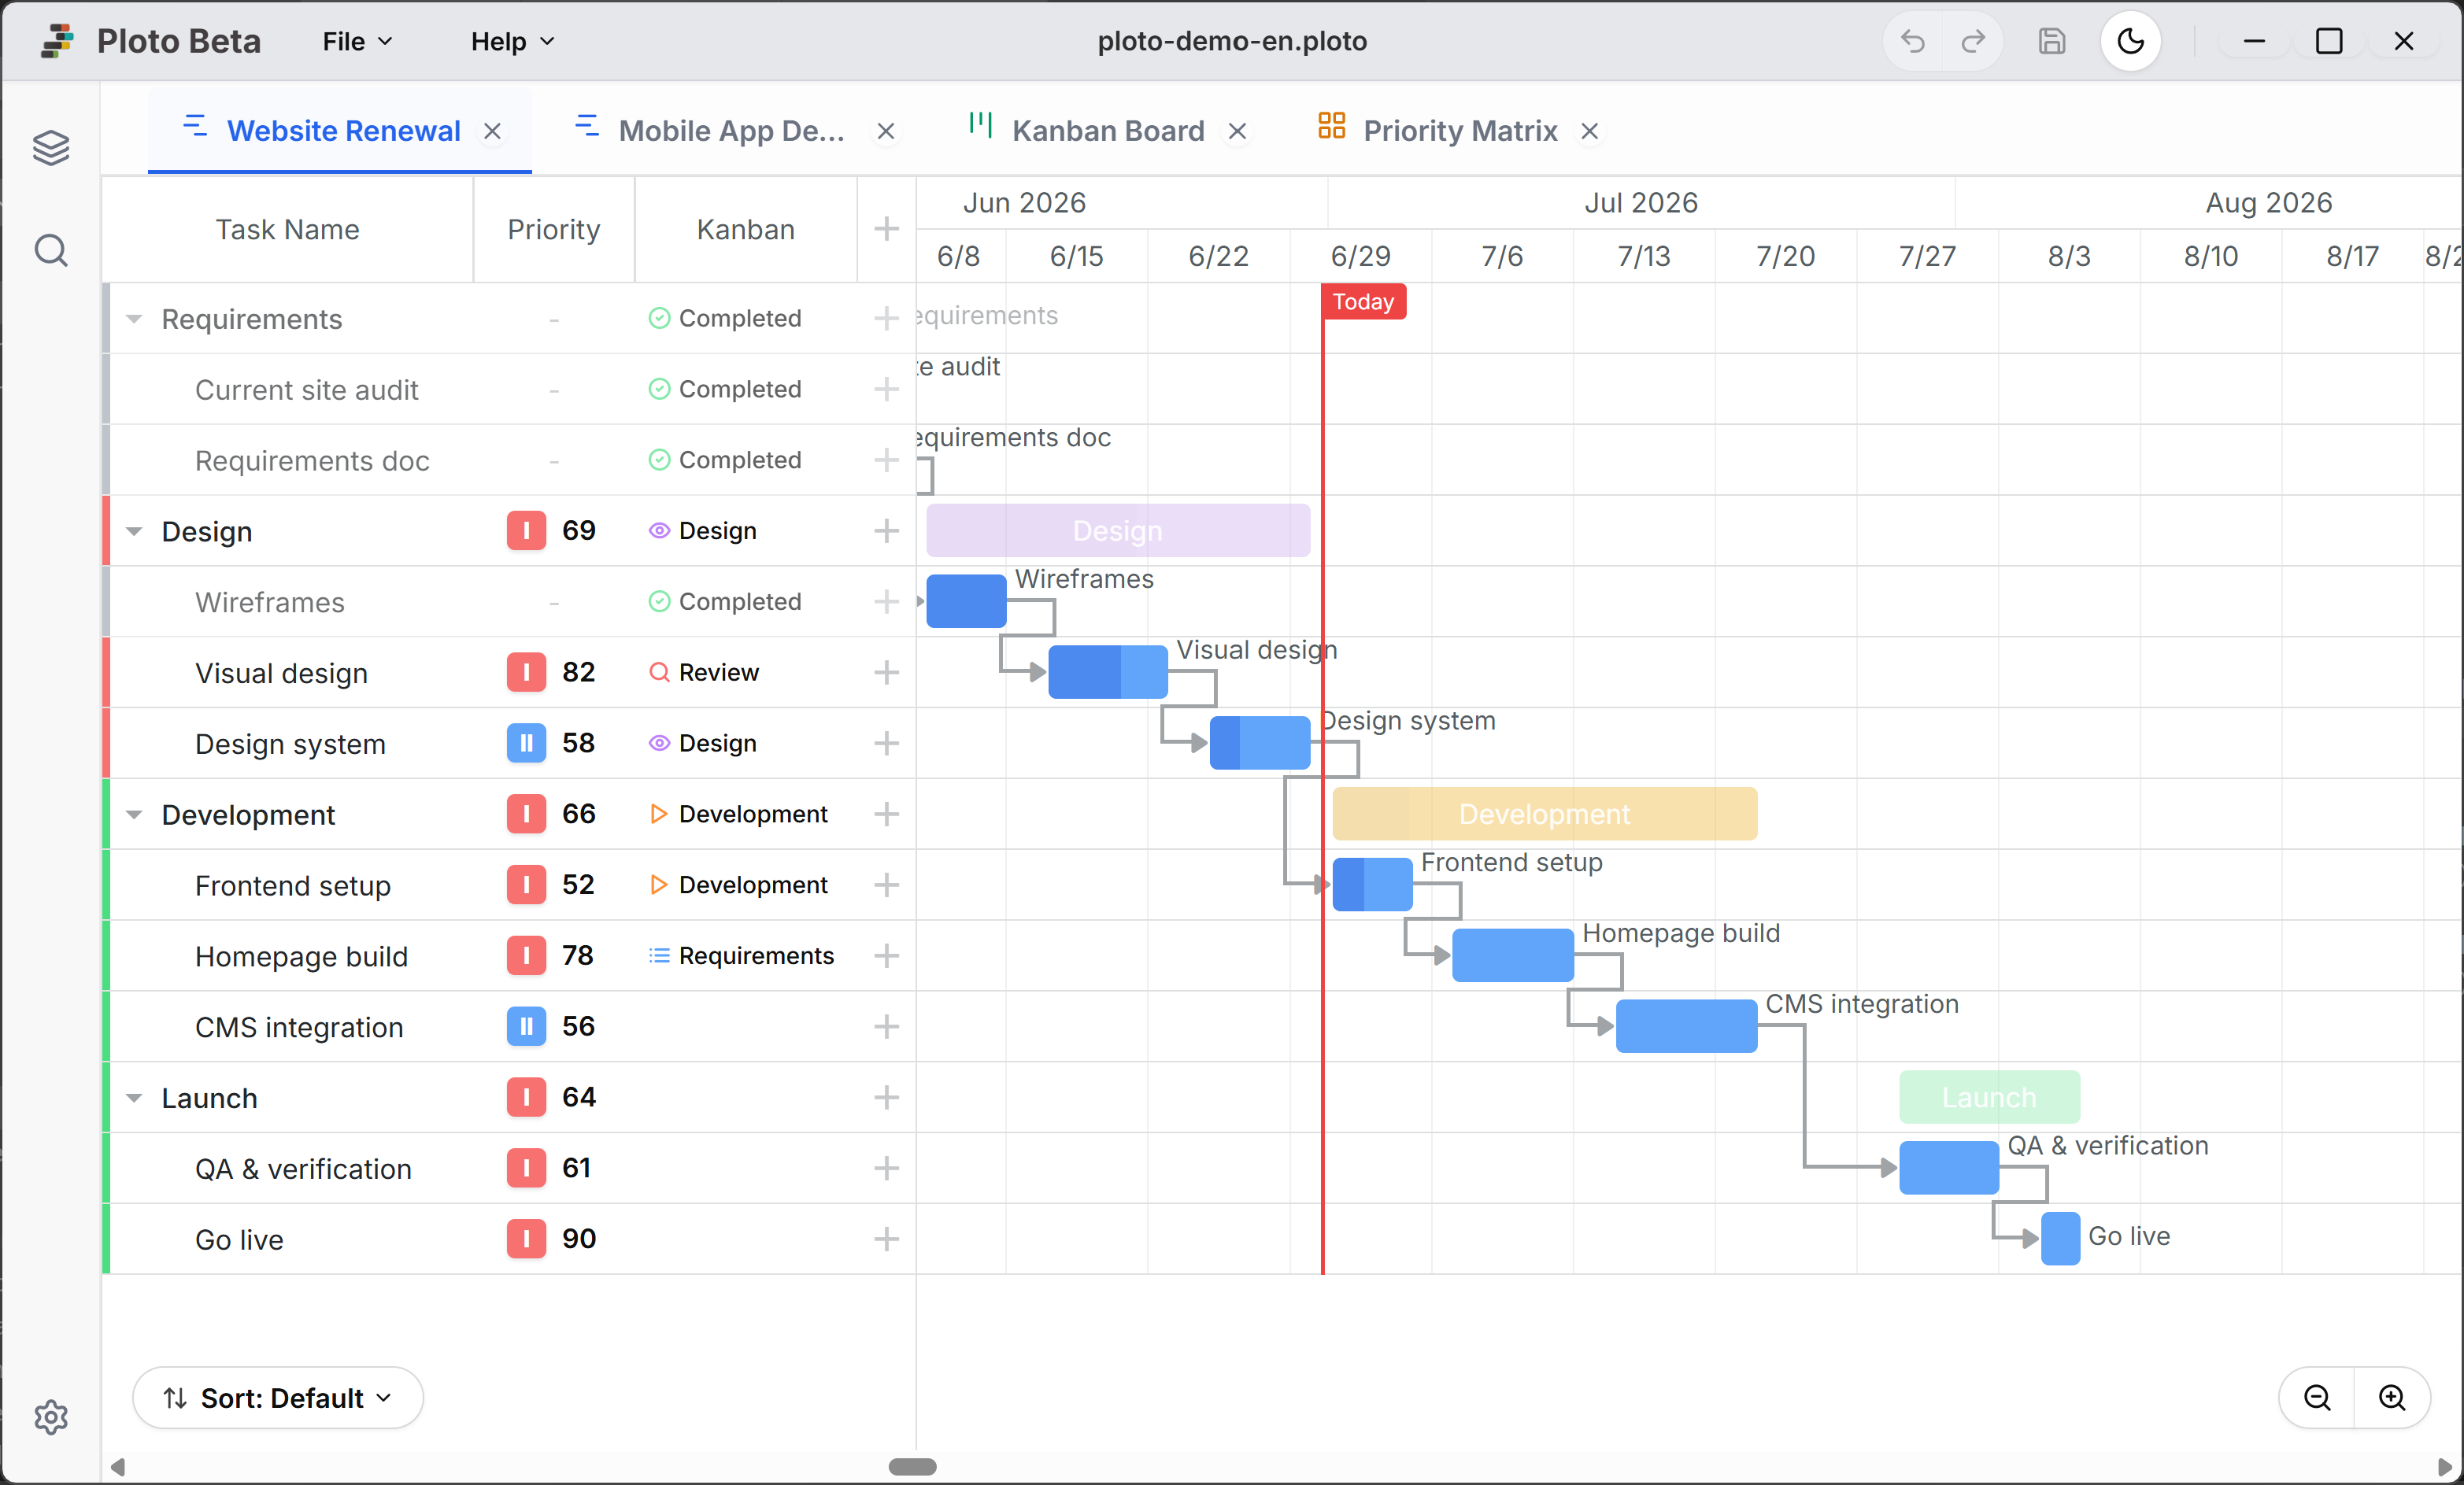
From here, follow a single task through five views and see how differently the same work can look, screen by screen.
When does it start, when does it end? What has to finish before it can begin? What a Gantt chart shows you is one cross-section, cut along the axis of time.
Even at 90% complete, a task is not necessarily on track. What is happening now, and where is it stuck? A Kanban board shows what a timeline cannot: where the work really stands.
Free plan New boards need Pro (existing ones stay editable)
Read the manual →Dates, progress, and status are not enough to understand difficult work. Why was that decision made? What was researched, and how far did the thinking go? Add the context that numbers and fields cannot capture directly to the task.
When priority is only High, Medium, or Low, every task tends to end up High. How urgent is it, and how important is it really? Separating those questions reveals the differences between tasks.
The tasks that now carry dates, status, context, and priority are finally spread across a single canvas. Instead of snapping everything to a grid, move tasks, draw relationships, and add the summaries you need. It is a whiteboard for grasping the whole through position and connection.
Free plan New boards need Pro (existing ones stay editable)
Read the manual →Start the AI agent you already use in the sidebar terminal. Describe your plan, and it can build a Gantt chart by working directly with Ploto.
Launch your installed Claude Code, Codex, or opencode from PowerShell in the sidebar. Ploto provides the connection setup.
Ask it to plan next month's store opening. Via MCP, AI can edit tasks, dates, and dependencies while you watch the chart change.
You control whether AI may edit. Check its changes in Ploto and save the project when you are satisfied.
Try up to 60 AI operations in Ploto for free. AI Terminal is a separate one-time purchase from Pro.
See AI Terminal pricing and free trialCheck the actual screens and step-by-step instructions before installing. No account is required, and the essential features remain free with no time limit, so you can start using anything that looks useful.
From launching the app to saving your file: the File and Help menus and the sidebar panels. Start here.
Read the manual →Drag bars to adjust dates and progress, link tasks with dependencies, and reflect holidays and company days off.
Read the manual →Manage the same tasks as columns of process steps. Moving a card changes its status, and each column can apply its own standard to-dos.
Read the manual →Write a record for each task in one long note, then search across all of them later.
Read the manual →Lay tasks out freely as a diagram, connect them with lines, and drop progress widgets onto the board.
Read the manual →Place tasks on the urgency and importance axes to decide what deserves your attention now.
Read the manual →Creating and editing Gantt charts and importing or exporting Excel files stay free without a time limit. Choose the one-time Pro upgrade to create Kanban and other views, or the separately sold AI Terminal to work with your own AI.
Pro is needed to create new views such as Kanban. You can still edit existing views without Pro (whiteboards created by someone else are view-only). AI control of whiteboards is planned for a future update.
Buy Pro and AI Terminal separately from the License screen in the app, via Microsoft Store or the web. A web serial code is tied to the PC specified at purchase and validates offline after activation. AI service fees are separate.
Normal creation, editing, and saving do not require an internet connection or cloud storage. Project data stays on your PC. AI integration may connect to the AI service you choose.
Creating, editing, and saving tasks requires no internet connection. AI integration follows the connection requirements of your AI CLI and service.
Your data is stored in a .ploto file on your PC. Ploto does not automatically send its contents to external servers.
Install Ploto from Microsoft Store and receive updates through the Store as well. There is no need to find and reinstall a new installer for every release.
No account, no monthly contract. Download it and every essential feature is yours to use for free from day one.
* Compatible with Windows 10/11. Ships with local SQLite 3 support.
Send us your bug reports, feature requests, or general feedback.